The journey to refine and perfect predictive models is ongoing in the vast and evolving landscape of machine learning. At the heart of this quest lies a pivotal tool, the confusion matrix, which emerges as a beacon for those navigating the complexities of model evaluation. As we embark on a deeper exploration of machine learning methodologies, a natural curiosity arises, prompting us to ask, “What is a confusion matrix?” This question marks the beginning of a deeper dive into understanding the intricacies of model performance assessment. It’s an invitation to explore beyond the surface, to uncover the layers that reveal how accurately a model can predict outcomes.
In this blog post, we’re setting the stage for a comprehensive discussion, guiding you through the nuances of this essential tool without delving into its specifics just yet. Join us as we pave the way to discovering how the confusion matrix can be a key to unlocking greater insights into your machine learning models, enhancing their accuracy and effectiveness.
A confusion matrix is a performance measurement technique for a machine learning classification algorithm. Data scientists use it to evaluate the performance of a classification model on a set of test data when the actual values are known. For example, classification accuracy can be misleading, especially when two or more classes are in the dataset.
Consequently, calculating the confusion matrix helps data scientists understand the effectiveness of the classification model.
The confusion matrix visualizes the accuracy of a classifier by comparing the actual values and the predicted values. In addition, it presents a table layout of the different outcomes of the prediction, such as the table below:
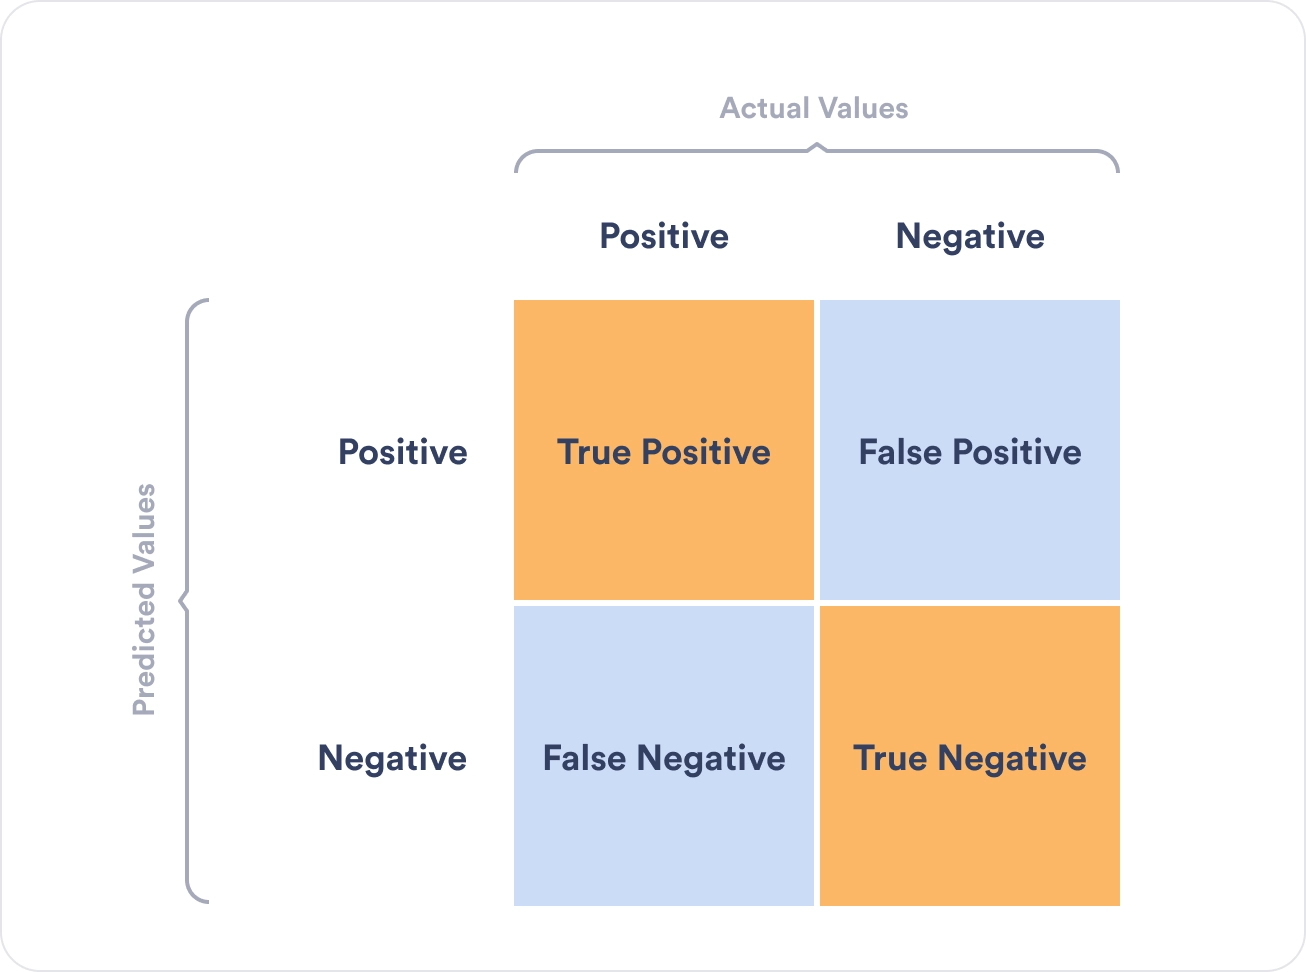
Let’s decipher the confusion table:
Now that we have deciphered the confusion table, let’s understand each value.
Let’s consider the following example to understand the confusion matrix and its values better. Suppose we want to create a model that can predict the number of patients suffering from migraines.
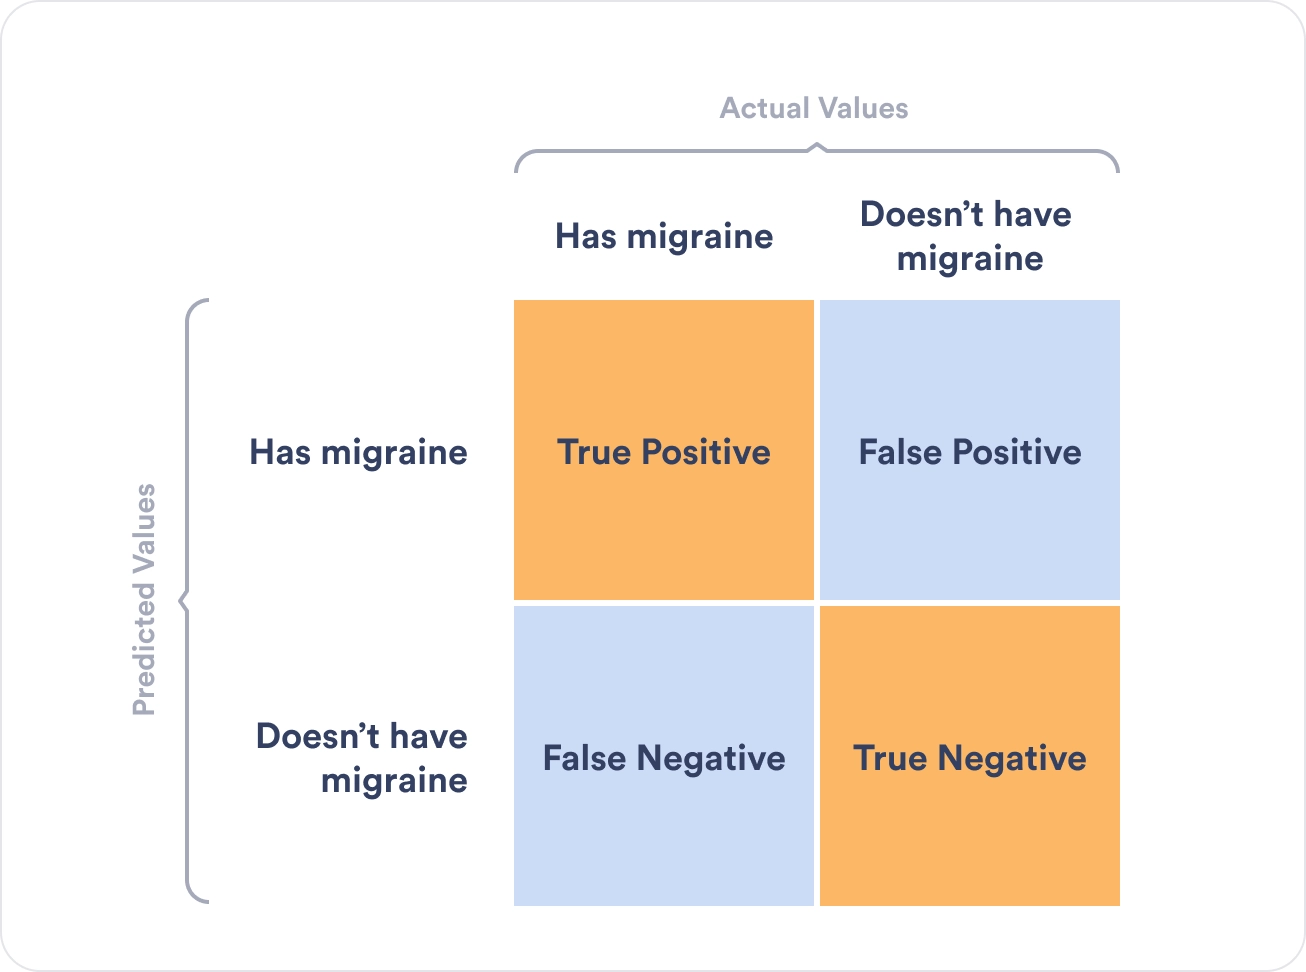
In this case:
Let’s consider the following numbers:
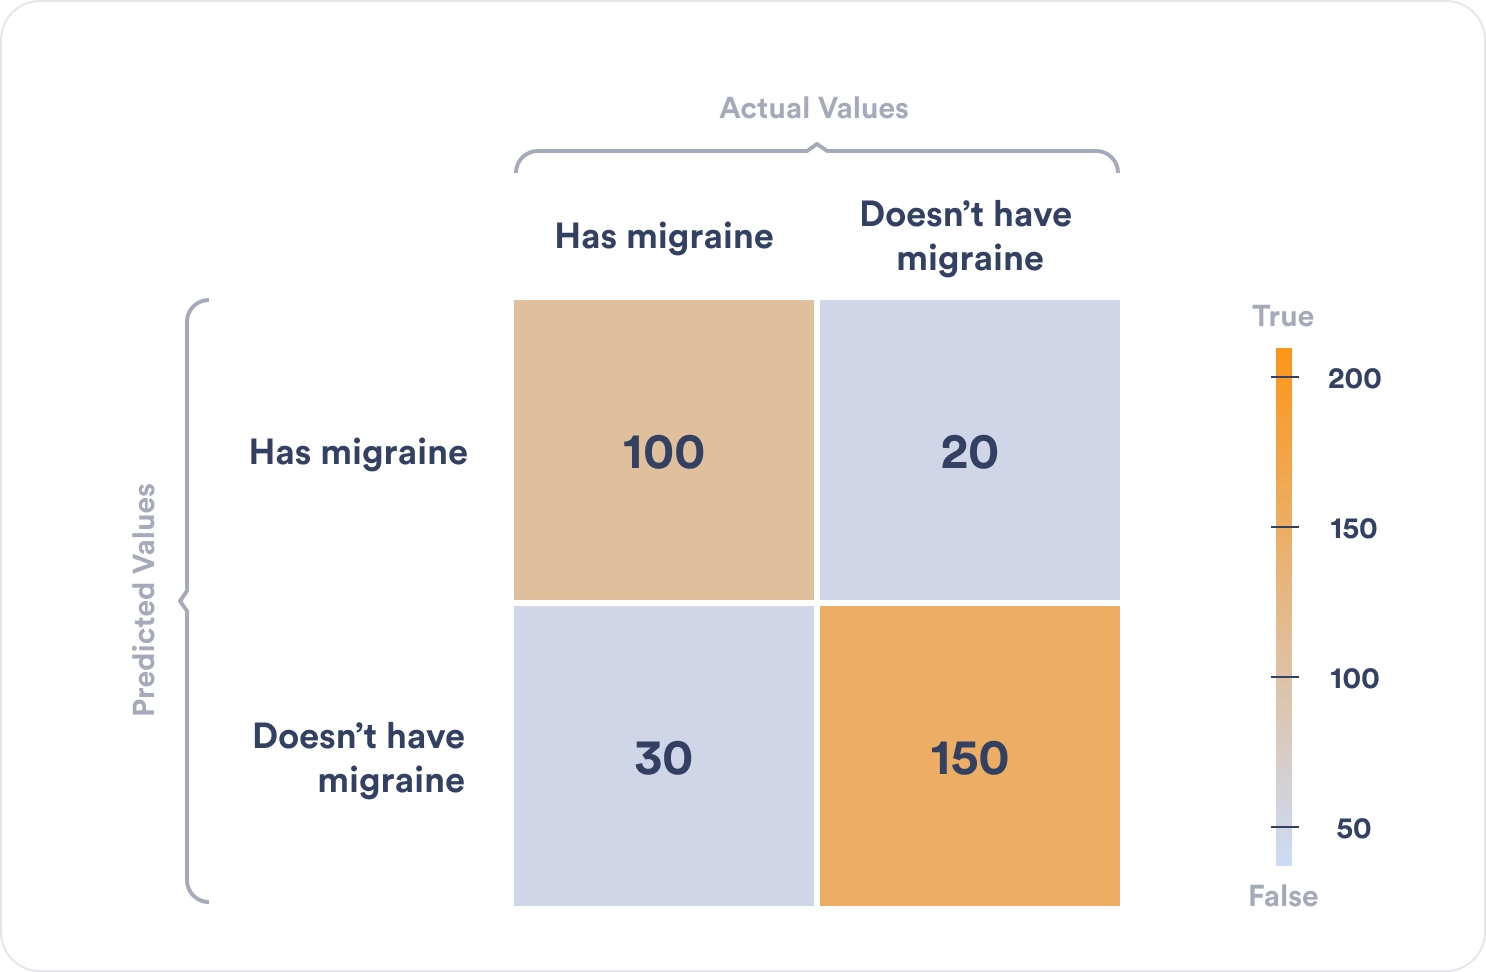
Let’s break the numbers down.
Consequently, the true positives and the true negatives tell us how many times the algorithm correctly classified the samples. On the other hand, the false negatives and false positives indicate how many times the algorithm incorrectly made predictions.
Once we have filled out the confusion matrix, we can perform various calculations for the model to understand its accuracy, error rate, and more.
Once the confusion matrix has determined the number of True Positives (TP), True Negatives (TN), False Negatives (FN), and False Positives (FP), scientists can determine the model’s classification accuracy, error rate, precision, and recall.
Classification accuracy is one of the most critical parameters to determine because it defines how often the model predicts the correct output. The higher the accuracy, the better the model. To calculate the model’s accuracy, consider the following formula:
Accuracy = TP+TN / TP+FP+FN+TN
Let’s consider the example of predicting patients with migraines. In that instance, the accuracy of the machine learning algorithm is 100+150/100+20+30+150 = 0.83
This means that the machine learning algorithm is 83% accurate in its predictions.
Also referred to as the error rate, the misclassification rate defines how often the model makes incorrect predictions. The error rate is calculated through the following formula:
Error rate = FP+FN/TP+FP+FN+TN
Based on the example above, the miscalculation rate is 20+30/100+20+30+150 = 0.17
Hence, the machine learning algorithm is 17% inaccurate in its predictions.
Precision compares the number of correct outputs provided by the model (true positives) to the total number of classified positive samples (true positives and false positives). It is one indicator of the model’s performance and helps scientists measure its ability to classify positive samples.
The model’s precision can be calculated using the following formula:
Precision = TP/TP+FP
In our case, precision equals 100/100+20 = 0.83
This means that out of all the positive predictions, 83% were true.
Recall lets data scientists measure the model’s ability to detect positive samples. The higher it is, the more positive samples the model has detected.
It is calculated as the ratio between the number of positive samples correctly classified (TP) to the total number of positive values.
Recall = TP/TP+FN = 100/100+30 = 0.76
This means that out of all the actual positive cases, only 76% were predicted correctly.
| Precision | Recall |
| Helps data scientists measure the model’s ability to classify positive samples. | Helps data scientists measure the number of positive samples correctly classified by the model. |
| Scientists consider positive and negative samples to calculate the model’s precision. | Scientists only consider all positive samples to calculate the model’s recall. |
| Scientists consider all positive samples, including those that the model identified incorrectly. | Scientists only consider the positive samples correctly classified by the model, disregarding negative samples classified as positive (FP). |
A confusion matrix allows data scientists to understand how effective their machine learning algorithm is in making correct predictions. It also allows them to understand incorrect predictions and calculate the error rate to improve the machine learning lifecycle.


