Precision vs Recall: A Comprehensive Guide to Key Metrics in Machine Learning
So, you think you’ve got machine learning all figured out? Well, precision vs. recall might still throw you a curveball. These two metrics are like the heart and soul of a model’s success, but they can be a bit tricky to wrap your head around at first.
Don’t worry, though—we’re here to break these concepts down for you.
What is Precision?
Precision is a measure of how accurate the positive predictions of a model are. Think of it in terms of a spam filter for your email. Precision helps you understand how many emails flagged as spam are spam. In other words, it answers the question: “Out of all the items labeled as positive, how many were truly positive?”

Let’s break it down:
Imagine you receive 100 emails in your inbox, and your spam filter identifies 100 of these emails as spam. Out of these 100 flagged emails, only 90 are genuinely spam, while the remaining 10 are legitimate emails mistakenly marked as spam.
Let’s do the math:
Precision Formula:
Precision = True Positives/( True Positives + False Negatives)
In this case:
- True Positives (TP) refer to the 90 emails correctly identified as spam
- False Positives (FP) refer to the ten legitimate emails incorrectly marked as spam
Using the precision formula:
Precision = 90/(90+10 ) = 90/100 =0.9
So, the precision of this spam filter is 0.9, or 90%. This means that 90% of the emails labeled as spam are indeed spam, while the remaining 10% are not. In other words, the 10% is a false positive.
What is Recall?
Recall measures the ability of a model to identify all actual positive cases. It answers the question: “Out of all the truly positive items, how many did we correctly identify?” This is particularly relevant when evaluating a model’s performance in pattern recognition tasks.
Again, let’s consider the example of a spam filter. Imagine you receive 200 emails in your inbox, and out of them, 10 are actually spam. The filter identifies 90 of these spam emails correctly but misses 10. Additionally, let’s assume there are no false positives for simplicity, so we focus on the model’s ability to catch spam.
Mathematically speaking:
Recall = True Positives/(True Positives + False Negatives)
Recall Formula:
In this scenario:
- True Positives (TP) is 90 referring the spam emails correctly identified as spam
- False Negatives (FN) are ten referring to the spam emails that were missed and not identified as spam)
Using the formula, the recall would be:
Recall = 90/(90+10) = 90/100 = 0.9
So, this spam filter’s recall is 0.9, or 90%. This means the model successfully identifies 90% of the spam emails but misses 10%. In other words, these ten emails are false negatives.
Note that True Positives (TP), True Negatives (TN), False Negatives (FN), and False Positives (FP) are critical components in the confusion matrix in machine learning.
Precision vs Recall: Key Differences
It can be confusing. Let’s break things down even more with this table defining and comparing each term side by side to understand recall vs. precision better.
| Metric | Precision | Recall |
| Definition | Measures the accuracy of positive predictions. | Measures the ability to identify all actual positive cases. |
| Question | How many of the emails labeled as spam are indeed spam? | Of all the actual spam emails, how many did we correctly identify? |
| Formula | Precision = True Positives/( True Positives + False Negatives) | Recall = True Positives/(True Positives + False Negatives) |
| Focus | Accuracy of the positive predictions. | Completeness of the positive predictions. |
| Goal | Minimize false positives (legitimate emails marked as spam). | Minimize false negatives (spam emails missed by the filter). |
| Example | Spam filter labels 100 emails as spam:- 90 are indeed spam (True Positives, TP)-10 are legitimate emails marked as spam (False Positives, FP) | Inbox has 100 actual spam emails:- Filter catches 90 spam emails (True Positives, TP)- Misses ten spam emails (False Negatives, FN) |
The Precision-Recall Trade-off
In precision vs. recall machine learning, you often need to find the right balance between precision and recall. This can be challenging as improving one can lead to a reduction in the other. As such, you have to consider your application’s specific needs.
We understand by now that when adjusting a model to be more precise, we aim to reduce the number of false positives. What is the trade-off here? This can increase false negatives, meaning the model might miss more true positive cases.
Conversely, improving recall and adjusting a model to catch more positive cases might increase the number of false positives.
Let’s consider the following scenario. Imagine you’re developing a machine learning model to diagnose a disease from medical tests. Here’s how precision vs. recall would play out in this context:
- High Precision Focus: If you prioritize precision, you want to ensure that the model’s prediction that a patient has the disease is almost always correct. This is beneficial because it means fewer healthy people will be wrongly diagnosed. However, focusing too much on precision might mean the model misses some patients who actually have the disease, thus lowering recall.
- High Recall Focus: If you prioritize recall, you want the model to catch as many cases of the disease as possible, even if it means some healthy patients are wrongly diagnosed. This is useful in scenarios where missing a single case of the disease could be very harmful. However, it might also lead to more false positives, meaning more healthy people will undergo unnecessary further testing.
So, what can we do to find the right balance? Well, it all depends on the application and the consequences of false positives and negatives. Here are a few considerations:
- Consequences of False Positives: If the cost or harm of a false positive is high, like unnecessary treatment or stress in a medical diagnosis, you might prioritize precision.
- Consequences of False Negatives: If the cost or harm of a false negative is high, such as missing a disease diagnosis that could worsen if untreated, you might prioritize recall.
Luckily, some fields have regulatory standards that dictate the acceptable balance between precision and recall, especially in healthcare, finance, and security.
Precision-Recall Curve
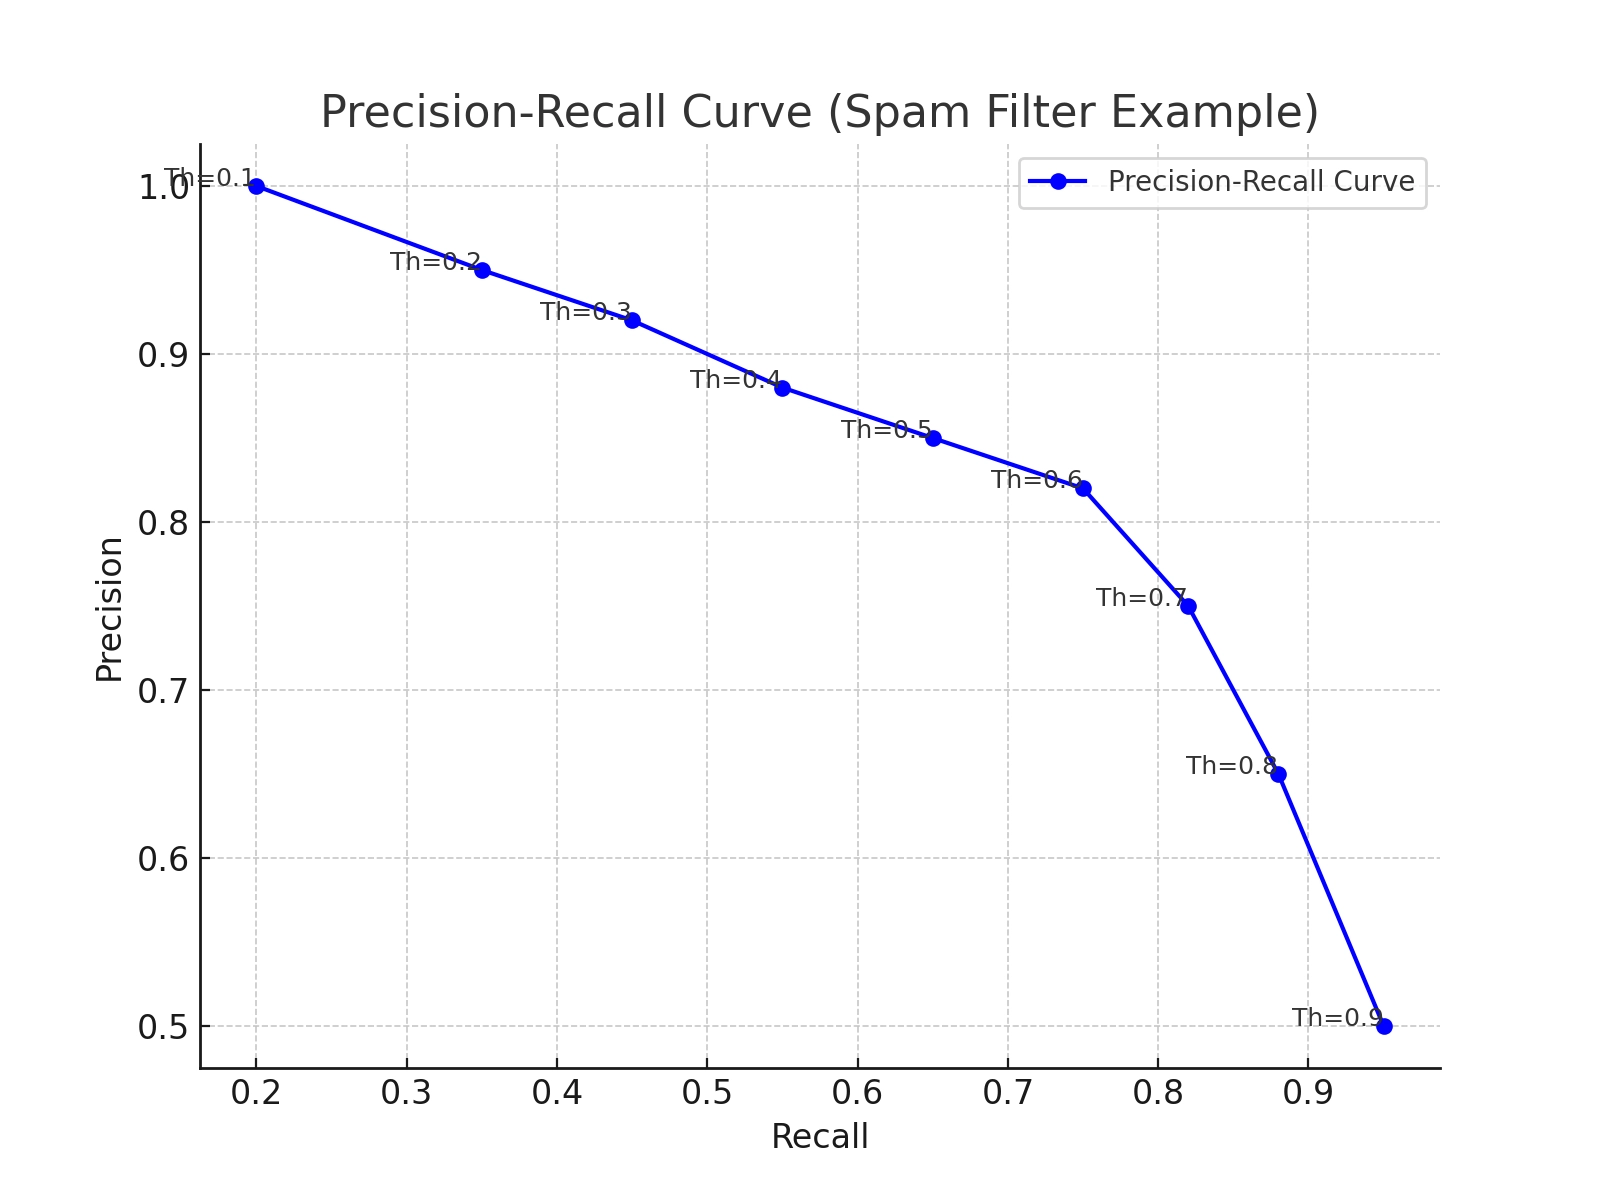
The precision-recall curve is a graphical representation that shows the trade-off between precision vs. recall for different threshold values. The curve plots precision on the y-axis and recall on the x-axis. Each point on the curve represents a different threshold value for classifying positive cases.

By examining this curve, you can see how precision and recall trade off against each other. As a result, it helps data scientists visualize a model’s performance and select the best threshold.
By considering our spam filter example, let’s define some terms:
- Thresholds: The threshold is the value above which a model classifies a data point as positive. It determines the score above which an email is classified as spam. Lowering the threshold typically increases recall (catching more spam) but decreases precision (more false positives). Raising the threshold typically increases precision (fewer false positives) but decreases recall (missing more spam).
- Curve Points: Each point on the precision-recall curve corresponds to a different threshold. You see how precision and recall change as you move along the curve.
The closer the curve is to the upper right corner, the better the model’s performance. This means high precision and high recall. In the example visualization, the curve starts with high precision and low recall. As the threshold decreases, recall increases, but precision decreases. A model with a curve that hugs the upper right corner performs well, indicating it can maintain high precision even as recall increases.
The F1 Score: Balancing Precision and Recall
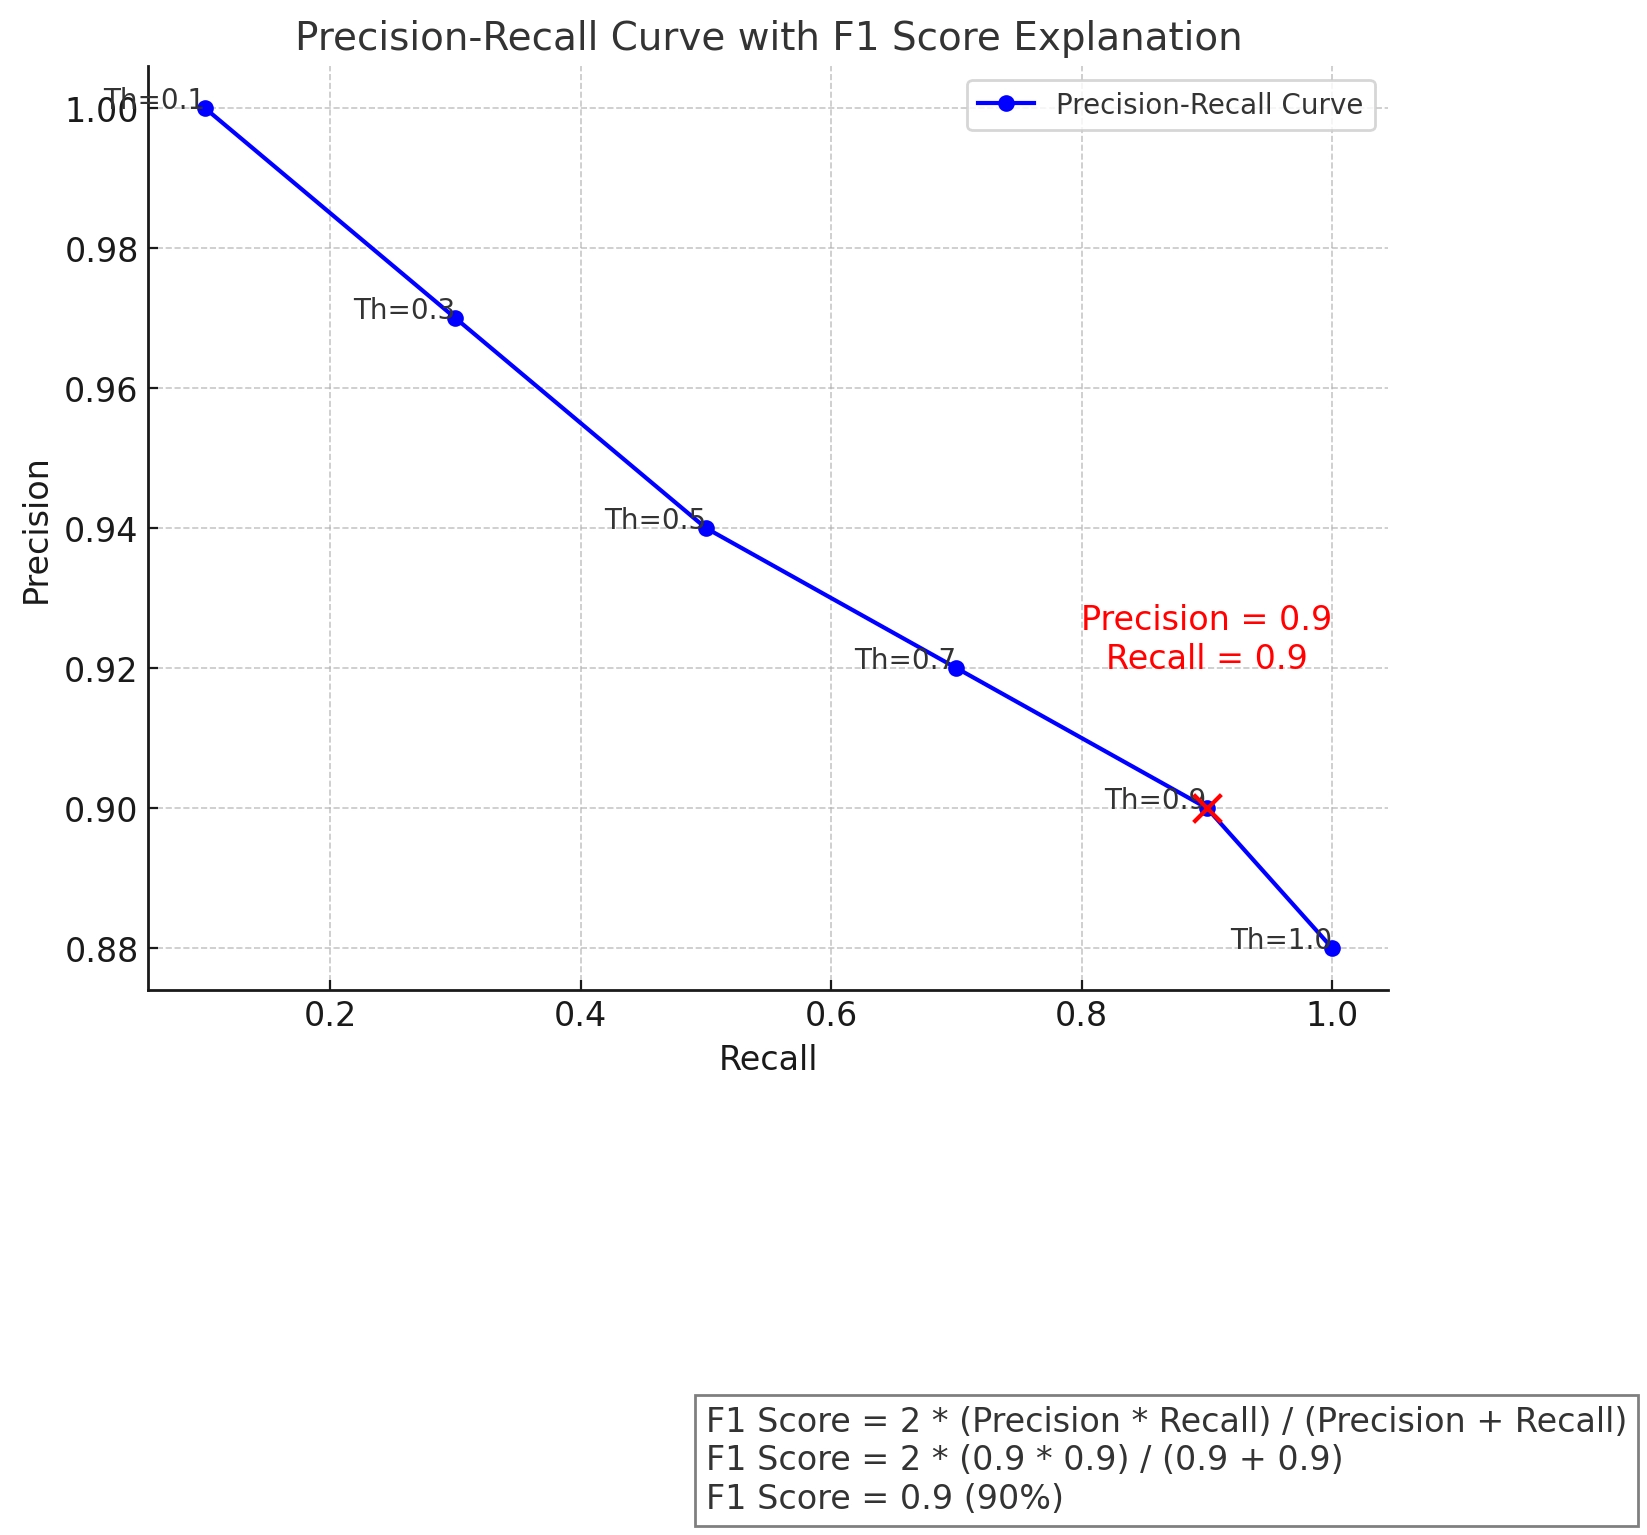
The F1 Score is a metric that combines precision and recall into a single number. It ranges from 0 to 1, with 1 being the best possible score. This helps evaluate a model’s overall performance, especially when precision and recall need to be balanced.

Formula:
F1 Score = 2 [(Precision Recall)/(Precision + Recall)]
Let’s use the same spam filter example where:
- Precision = 0.9 (90%)
- Recall = 0.9 (90%)
Let’s plug these values into the formula:
F1 Score = 2 [(0.9 0.9)/(0.9 + 0.9)] = 2 (0.81 /(1.8) = 2 0.45 = 0.9
So, the F1 Score is 0.9, or 90%. But what does it mean? A high F1 Score means the model has a good balance of precision and recall. In our spam detection example, both metrics are performing well. The model catches most spam emails (high recall) while ensuring that not too many legitimate emails are marked as spam (high precision).
Best Practices for Optimizing Precision and Recall
Balancing precision and recall can be tricky, but there are several strategies you can use to find the best mix that works for you. Here are some practical tips:
Understand Your Problem Domain
Determine your problem and what is more important for your specific application to guide your focus. Different issues and topics in machine learning need different balances between precision vs. recall.
For example, if you have a model in healthcare diagnosis, you might prioritize recalling the catch-all potential cases of a disease, even if it means having more false positives. This approach ensures that as few cases as possible are missed, which can be critical in early disease detection.
On the other hand, considering the filtering model, it may make sense to prioritize precision to ensure legitimate emails are not marked as spam, even if some spam emails get through.
Tune Thresholds
Adjusting the decision threshold can help you find the right balance between precision and recall. So, try experimenting with different thresholds and evaluate their impact on precision and recall to find the optimal points for your needs.
For example, lowering the threshold increases recall by catching more positives. However, it decreases precision by including more false positives.
Conversely, raising the threshold increases precision by including fewer false positives but decreases recall by missing more true positives.
Regularly Monitor Metrics
Once your AI model is deployed, monitor its performance over time. Precision and recall can change due to shifts in data distribution or other factors. For instance, you can set up monitoring tools that alert you when precision or recall drops below a certain threshold.
Also, regularly review and evaluate your model’s performance to ensure it continues to meet your needs.
Lastly, you need to be ready to retrain or adjust your model as new data becomes available or as the characteristics of your data change.
In summary, precision vs. recall in machine learning provides unique insights into a model’s performance. Understanding their differences and how to balance them will make you better equipped to create and evaluate machine learning models. Don’t forget to use the precision-recall curve and F1 Score to help balance and optimize your models, ensuring you get the best possible performance based on your needs.
Try our real-time predictive modeling engine and create your first custom model in five minutes – no coding necessary!
- Fully operational AI with automated model building and deployment
- Data preprocessing and analysis tools
- Custom modeling solutions
- Actionable analytics
- A personalized approach to real-time decision making


