Statistics Decision Tree Definition and Examples
A statistics decision tree (DT) is a tool using a tree-like model of decisions and their possible outcomes. As a decision support tool, a DT helps you explore all your options and their potential consequences in a single place. As a result, you can make faster, more informed, and wiser decisions. DTs are most applicable in statistics, data mining, and machine learning (ML). Let’s dig deeper into the topic to reveal more about DTs and their perks.
Decision Tree
A DT, a tool in general mathematics, probability, and statistics, is a visual representation that you can use in the decision analysis process. Decision analysis (DA) is a systematic, quantitative, and visual approach to help you make strategic business decisions.
DTs are also called tree diagrams and probability trees, which you can use to calculate the number of possible outcomes to determine the best ones. A DT is a popular predictive modeling approach used in statistics, data mining, and machine learning.
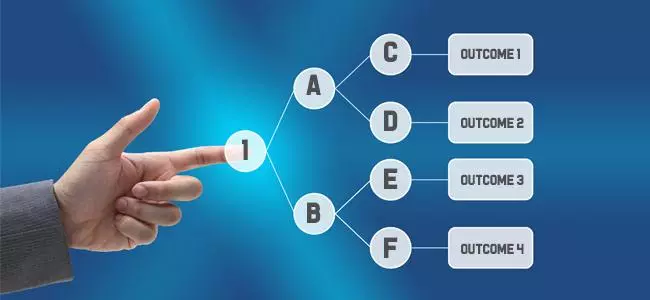
For example, a company might build a DT when opting for a capital project or choosing between two competing ventures. These decisions, shown by decision nodes, are based on the expected outcomes. For example, one result could be that “earnings are anticipated to grow by $5 million.”
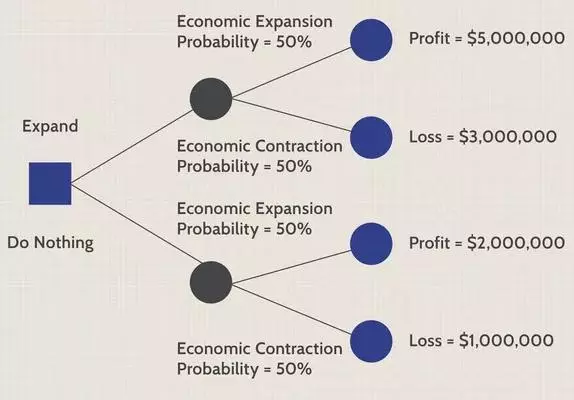
Statistics Decision Tree
A DT is a popular statistical learning method. The latter represents a framework for machine learning stemming from statistics and functional analysis, a branch of mathematical analysis. A DT helps you select statistics or statistical techniques suitable for the purpose and conditions of a particular analysis.
DTs enable you to chart out a statistical probability analysis by breaking down complex problems or branches. Each branch of the DT could be a possible outcome.
For instance, a DT can help digital marketers better understand the traffic on their sites and test whether they’re taking the right marketing steps.
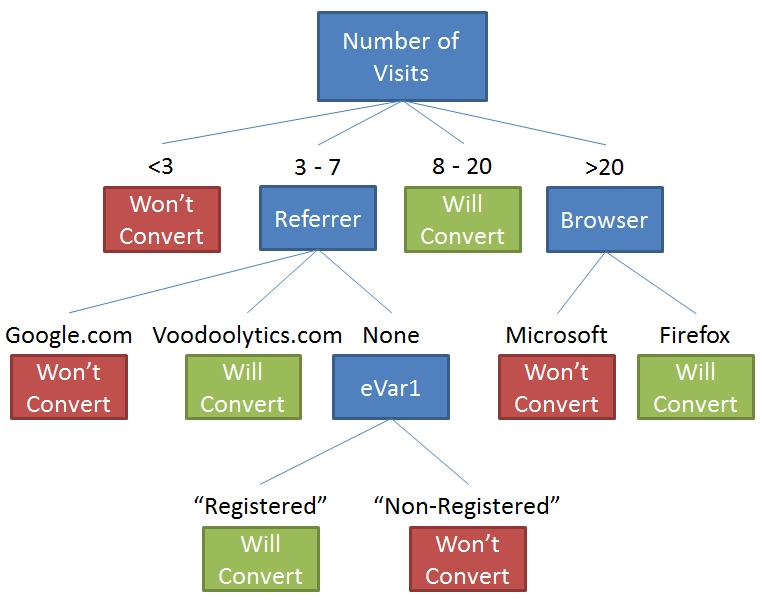
Decision Tree Modeling
Using statistical data to build a DT is also called the “construction of a tree.” Typically, a DT is drawn from left to right or from the root downwards. Like an ordinary tree, a DT consists of nodes and branches. Namely, a DT starts with a single node branching or splitting into possible outcomes. The first node is the root or the base.
Each of the outcomes generates additional nodes branching off into other possibilities. The result is a tree-like chain composed of a “root – branch – node -…- node.” The end of the chain is called a “leaf node.” Each internal node may grow into two or more branches.
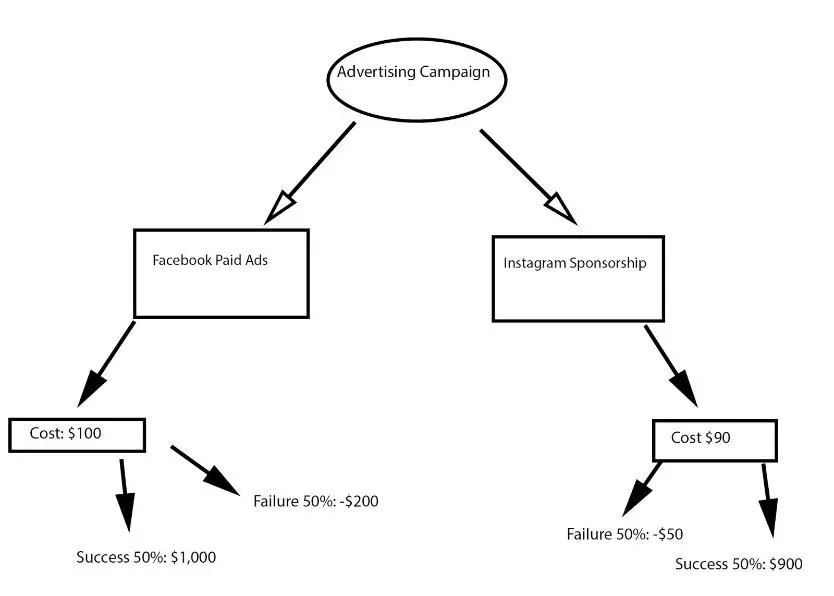
Decision tree modeling helps you create classification systems that predict or classify future observations. For example, let’s take a marketer to decide whether to structure a Facebook ads campaign or advertise on Instagram with the help of influencer sponsorships.
The first branch should represent the principal decision to be made. Then, it should branch into two options: FB paid ads and Instagram sponsorship, each with its possible outcomes. When the tree is complete, the company should calculate and evaluate the costs and probabilities of each branch to determine the best outcome.
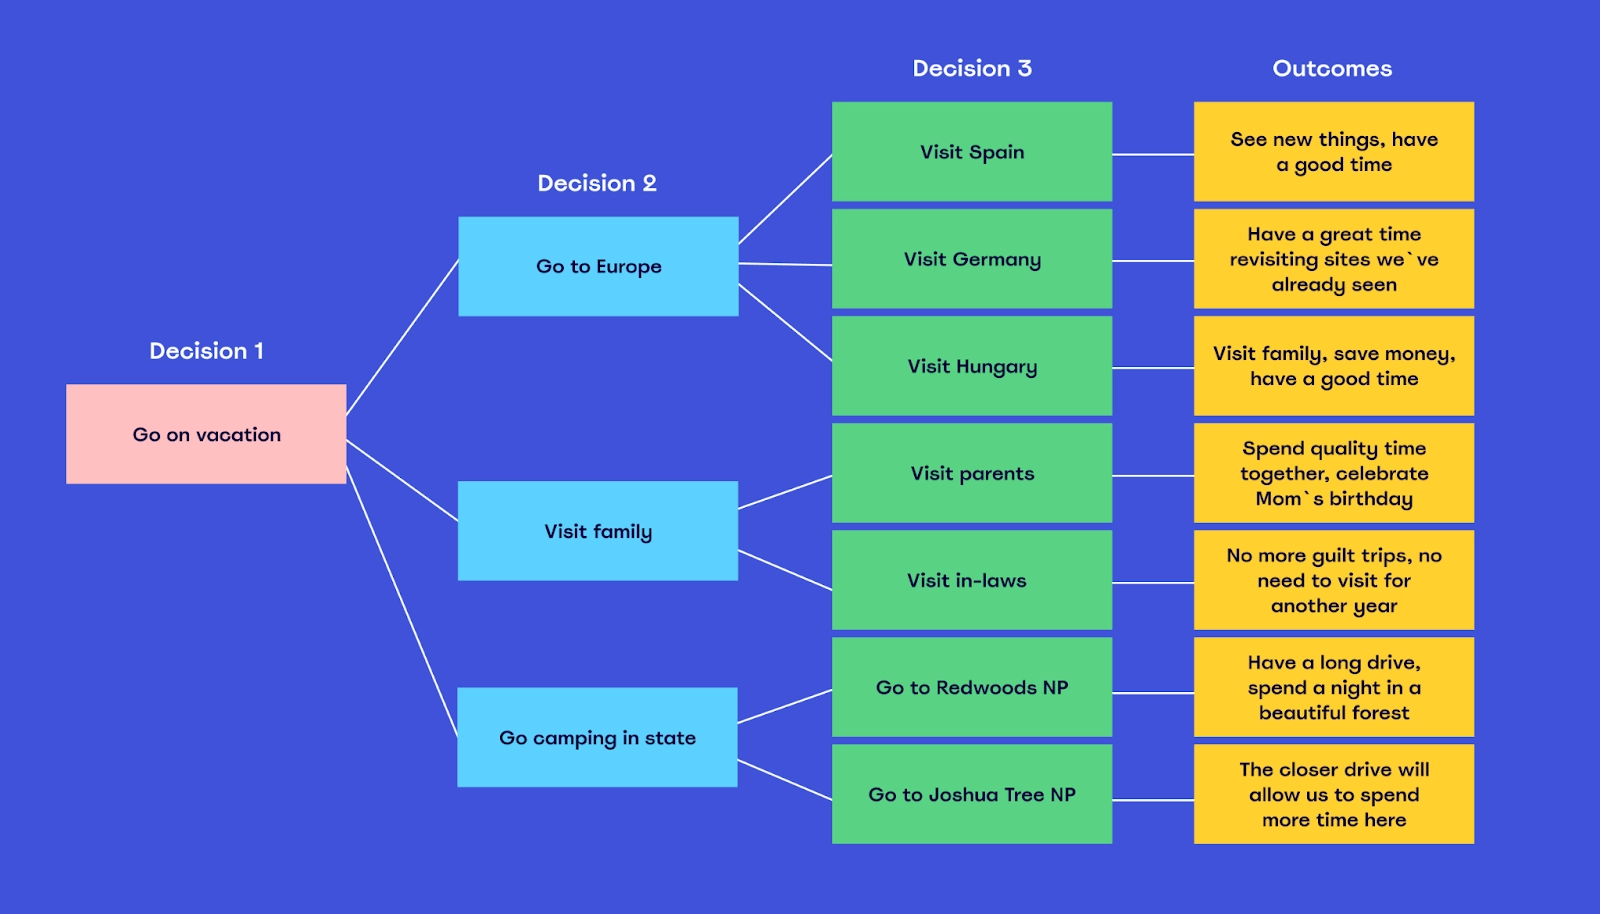
Many DTs are modeled for a specific scenario. However, DTs for different scenarios can be interconnected. For instance, you can connect a DT for more than one vacation destination option to the decision of “Where do you want to go?”
Advantages of a Decision Tree
A DT comes with more than one perk:
- It enables you to follow a decision process effectively.
- It helps you deal with a wide range of options.
- You can add new scenarios easily.
- It doesn’t require large amounts of hard or factual data for a decision process. Hard data is information, such as numbers or facts that can be proven. Contrary, soft data refers to information that is difficult to measure, e.g., people’s opinions or feelings.
- It helps you with the best, worst, and expected results for various scenarios.
The predictive analytics global market is forecast to account for about $10.95 billion by 2022 from $3.49 billion in 2016, according to a 2017 report by Zion Market Research. So, it’s no wonder that the interest in predictive analytics software is growing worldwide.
Such software lets you input the existing data and get scorecards, risk assessment models, or other models based on your specific needs. Such needs may include fraud and risk detection, targeted advertising, and product recommendations.
Decision Tree in Data Mining
What about a decision tree in data science or data mining? Data science is associated with capturing data, analyzing, and deriving insights from it. As for data mining, it’s about extracting useful information from a dataset and utilizing that information to unveil hidden patterns.
In data science, a decision tree starts with observations about an item (the branches) and reaches conclusions about the item’s target value (the leaves). DTs in data mining are of the following types:
- Classification Tree
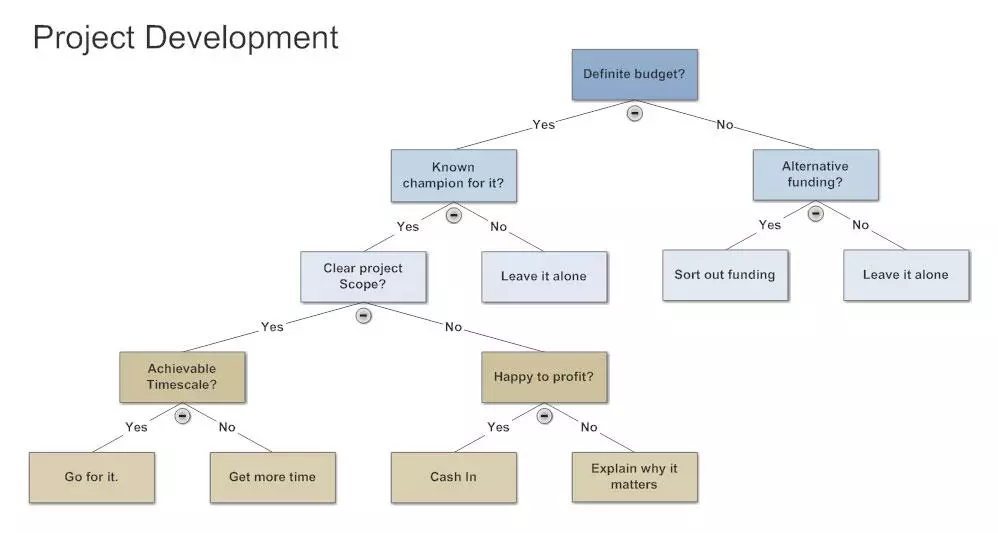
This type of tree splits the dataset into classes based on data similarity or homogeneity. “Yes” or “No” classes are frequently used in this case.
- Decision Tree Regression
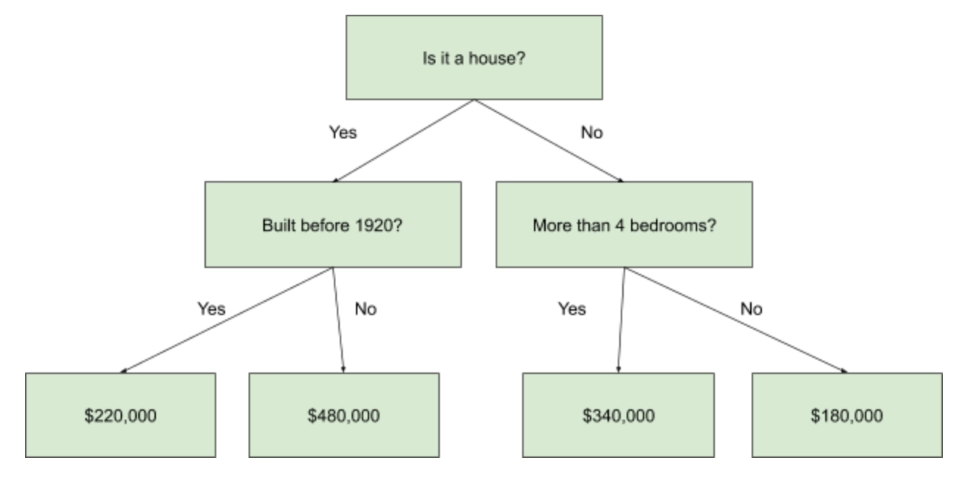
DT regression is employed to solve prediction problems. In this case, the predicted outcome can be regarded as a real number, e.g., the price of a product.
Conclusion
A statistics decision tree graphically represents alternative solutions to solve a given problem. It provides you with a map of the possible outcomes of a series of related choices and helps you determine the most effective result. A DT is a support tool in decision-making.


